Facilities teams generate a constant stream of data, from work orders and preventive maintenance to inspections and asset updates. But data alone doesn’t improve performance. What matters is tracking the right maintenance metrics and using them to guide decisions.
Without clear, standardized reporting, teams struggle to prioritize work, managers lack visibility into performance, and leadership can’t confidently plan for the future. The challenge isn’t a lack of data. It’s knowing which metrics actually matter.
In this blog, we discuss the top maintenance metrics you should be tracking, and solutions to help you do so. For a broader look at how maintenance fits into overall asset strategy, explore our guide to asset and maintenance management.
Why Maintenance Metrics Matter
Maintenance metrics are not just operational data points. They are a direct reflection of how effectively your facilities are running. When tracked consistently, they help organizations:
- Reduce unplanned downtime
- Improve asset reliability
- Increase technician productivity
- Control maintenance costs
- Make more informed capital planning decisions
The impact is significant. Reactive maintenance can cost 3 to 9 times more than planned work, while 55% of workplace leaders say that disconnected data from multiple sources continue to slow decision-making and limit visibility.
Because of this, the organizations that have success are the ones with easy access to their data, consistent methods for reporting, and use those metrics to drive action.
8 Facilities Maintenance Metrics to Track
While exact benchmarks vary by industry, several widely accepted maintenance performance indicators are commonly used across facilities management and asset management programs, and many of the benchmarks referenced in this blog are commonly cited from organizations such as SMRP, IFMA, and ISO asset management standards.
1. Preventive Maintenance Completion Rate
What it measures
The percentage of scheduled preventive maintenance tasks completed on time.
Why it matters
This metric reflects the consistency of your maintenance program. Missed preventive work often leads to unexpected failures and higher costs.
High-performing teams typically maintain 90–95% completion rates, ensuring assets are serviced before issues escalate.
2. Reactive vs. Planned Maintenance Ratio
What it measures
The proportion of maintenance work that is reactive versus planned.
Why it matters
A high percentage of reactive work signals limited visibility into asset condition and weak planning processes. It is also one of the clearest indicators of maintenance maturity.
Leading organizations aim to keep reactive work below 30%, steadily shifting toward more proactive strategies.
3. Maintenance Backlog
What it measures
The volume of open work orders and the time required to complete them.
Why it matters
Backlog reveals whether your team can keep up with demand. A growing backlog often signals resource constraints, inefficient workflows, or declining asset health.
A healthy backlog is typically 2–4 weeks of work, providing visibility without overwhelming capacity.
4. Mean Time to Repair (MTTR)
What it measures
The average time required to repair an asset after failure.
Why it matters
MTTR reflects how efficiently your team responds to issues. Delays often point to problems with coordination, parts availability, or access to asset data.
Reducing MTTR directly improves uptime and operational continuity.
5. Mean Time Between Failures (MTBF)
What it measures
The average time between asset failures.
Why it matters
MTBF is a key indicator of asset reliability. Increasing this metric means fewer disruptions and more predictable operations.
Organizations that invest in preventive and condition-based maintenance typically see steady improvements over time.
6. Maintenance Cost per Asset
What it measures:
The total cost required to maintain each asset.
Why it matters:
This metric helps identify assets that are too expensive to maintain and supports better repair versus replacement decisions.
It also provides critical input for long-term capital planning.
7. Asset Downtime
What it measures:
The total time assets are unavailable due to maintenance or failure.
Why it matters:
Downtime directly impacts productivity, revenue, and, in some environments, safety and compliance.
Reducing downtime is one of the fastest ways to improve overall operational performance.
8. Total Cost of Ownership (TCO)
What it measures:
The full lifecycle cost of an asset, including maintenance, operation, and replacement.
Why it matters:
TCO helps organizations move beyond short-term repair decisions and evaluate long-term cost efficiency. It’s also a critical input into capital planning strategies for facilities teams.
High-performing teams use TCO to identify high-cost assets early and guide capital planning decisions.
How to Track Maintenance Metrics Effectively
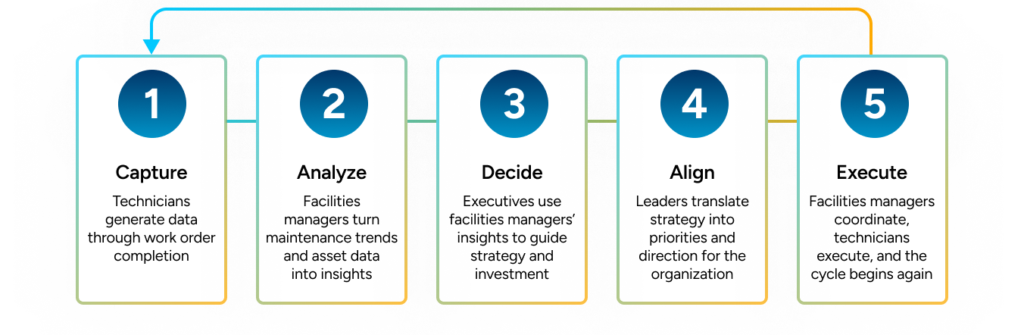
Tracking these maintenance metrics in a consistent way depends on how data is captured and shared across the organization.
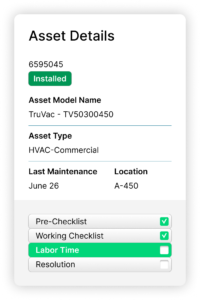
Technicians: Where Data is Captured
It starts with technicians in the field. Every work order, inspection, and preventive maintenance task generates the data behind these metrics. When captured in real time (using mobile tools within a CMMS or IWMS) this data becomes accurate, complete, and immediately usable.
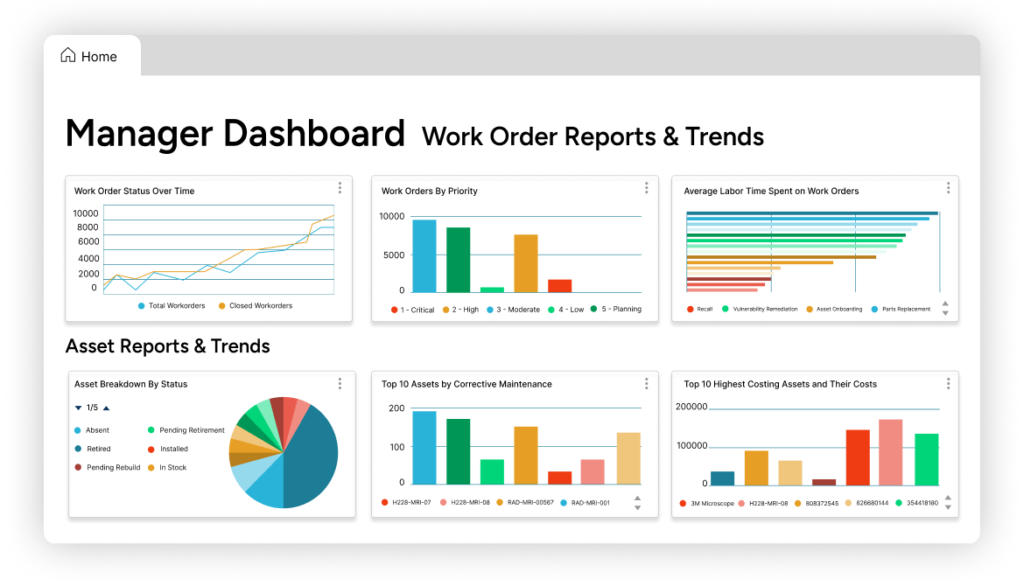
Facilities Managers: Where Data is Translated
From there, facilities managers analyze trends across work orders, asset performance, and maintenance activity. These insights help identify inefficiencies, improve technician workflows, and reduce recurring asset failures.
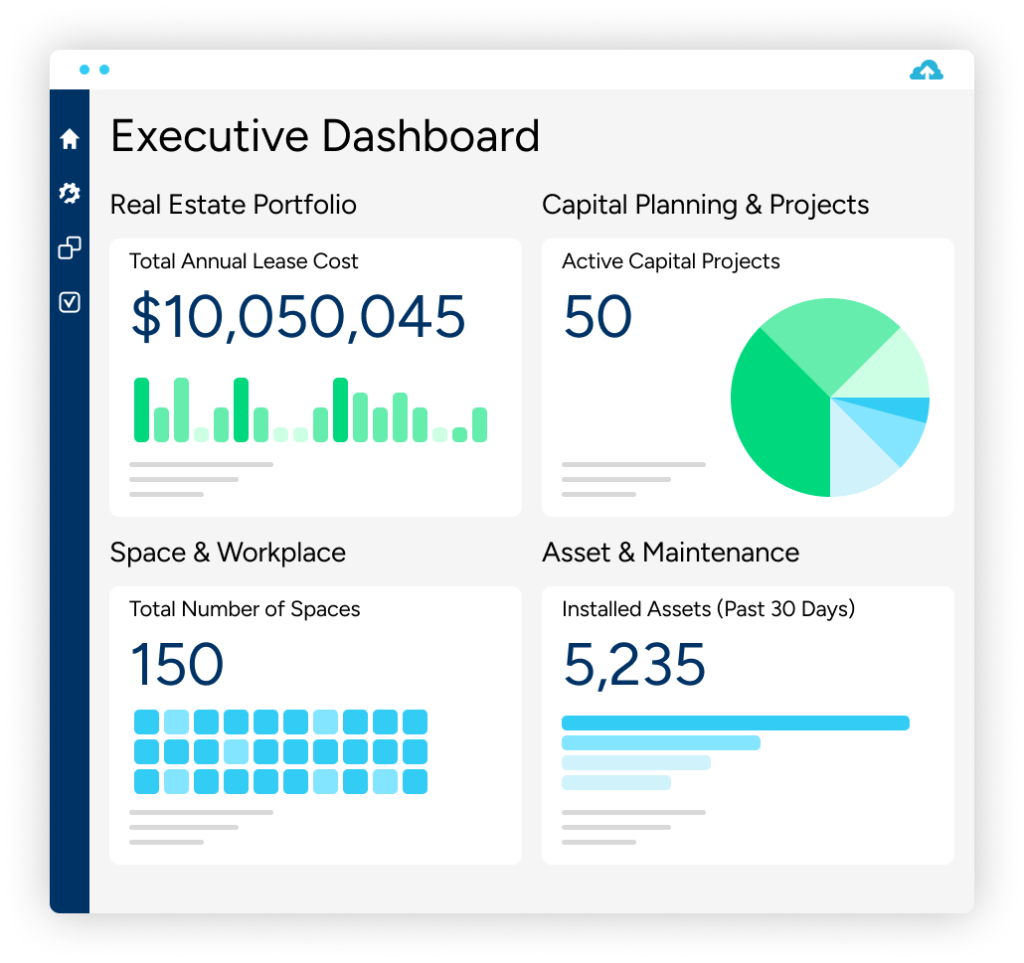
 Executives: Where Data is Acted On
While technicians focus on executing maintenance work and facilities managers evaluate operational performance, senior leadership requires a far more concise view of facilities operations. At the leadership level, metrics provide visibility into cost trends, operational risk, and long-term investment needs.
This entire process depends on one critical factor: connected data. Without a centralized system, reporting becomes manual, time-consuming, and often incomplete.

Tracking Maintenance Performance with Nuvolo
With Nuvolo’s Asset & Maintenance product, facilities teams capture operational data through work orders, preventive maintenance programs, inspections, and asset records. Technicians gain visibility into their assigned work and priorities, facilities managers can monitor operational trends and asset reliability, and leadership receives clear reports that support financial planning and long-term asset strategy.
For executives seeking broader visibility, Nuvolo Connected Workplace extends that foundation by bringing in real estate portfolio data, capital planning, and space insights together so they can begin to see their organization through one pane of glass.
This connected approach allows facilities operations to move beyond isolated asset and maintenance metrics and toward a reporting framework that connects day-to-day maintenance activity to long-term portfolio goals.
Turning Maintenance Metrics Into Better Decisions
Tracking metrics is only valuable if it leads to action.
When maintenance metrics are consistently captured and shared, facilities teams can:
- Identify issues before they lead to failures
- Shift from reactive to proactive maintenance strategies
- Prioritize assets that require the most attention or investment
- Align maintenance performance with capital planning decisions
Over time, this creates a more efficient, reliable, and cost-effective operation.
Final Thoughts
Maintenance metrics are not just numbers on a dashboard. They are a reflection of how your operations run.
By focusing on the right metrics, facilities teams can improve performance, reduce costs, and make better decisions across the entire asset lifecycle.
Start with a core set of metrics, track them consistently, and build from there.
That is how maintenance evolves from reactive work to a strategic advantage.
Learn how to turn technician data into executive insights
Download GuideLearn how to turn technician data into executive insights
Download Guide